Allt snabbare genombrott av global uppvärmning!

Dag Lindgren, sista ändring 240618

Här visas med nya kriterier på svenska att det globala temperaturklimatet ändrats i snabbt ökande takt, långt snabbare än vad den etablerade klimatforskningen ger intryck av Ett komplement till de många utmärkta klimatanalyser som utförts och till IPCCs gedigna arbete, som dock har eftersläpning och kanske är för försiktigt.

Studien har publicerats i Ökad variation i temperatur har betydelse (tidningenglobal.se)

Utgångspunkten, inspirationen, data och några engelska termer kommer från https://parisagreementtemperatureindex.com/ av Chris Priest, Brighton. Jag rekommenderar webben för djupare information om global uppvärmning. Jag tycker författaren gjort ett utmärkt nyskapande arbete. Utgångspunkten är Global Mean Surface Temperature (GMST). Milstolpar (Milestones) för temperaturökningen sätts till 0.50, 1.00, 1.25, 1.50, 1.75 och 2.00 grader C över förindustriell tid. Den förindustriella tiden sätts till genomsnittet 1850-1900, eftersom det inte finns pålitliga tidigare uppskattningar, men uppvärmningen är nog något större. Varje dags globala temperatur jämfört med förindustriell tid (anomali) registreras och utgör de data som analysen nedan bygger på.

Analysen resulterar i 4 tabeller över temperaturökningar över tiden: Första dagen en temperatur överskrids, första månaden, första året, när 100 dagar överskridit.

Tabell 1. Tidpunkt när en dagstemperatur uppnås första gången och hur länge det var sedan en lägre milstolpe först registrerades. https://parisagreementtemperatureindex.com/1000-day-climate-graphic-design/

GMST MilstolpeFörsta dag temp>MilstolpeÅr efter att tidigare Milstolpe passerades
0.75 CFeb 1941 
1.00 CJan 1958 19
1.25 CFeb 1995 37
1.50 CDec 2015 20
1.75 CFeb 2016 1
2.00 CNov 2023 7

Det tog 8 år att gå från varmaste dag 1.5 grader över förindustriell tid till att varmaste dag 2 grader över, men 57 år från att varmaste dag var 1 grad över tills den var 1.5 grader över. Jättestor skillnad mellan samma temperaturintervall nu och förut!

Tabell 2. Tidpunkt när första månaden över en Milstolpe inträffar och hur länge sedan ett lägre värde passerades  °C Milestones – From First Appearance to Permanence – Paris Agreement Temperature Index

MilstolpeÅr första månaden >MilstolpeÅr efter att tidigare Milstolpe passerades
0.751979
1.00199718
1.25201417
1.5020151
1.7520238
2.0020?

Det tog 9 år att högsta månadsvärdet höjdes från 1.25 till 1.75 grader. Det tog 35 år för högsta månadsvärdet att öka lika mycket från 0.75 till 1.25 grader över förindustriell. Jättestor skillnad för samma temperaturökning.

Tabell 3. Första året en milstolpe passeras och hur många år det tog sedan föregående milstolpe passerades 1000 Days above 1.5C before Trend passes 1.5C? (parisagreementtemperatureindex.com)

GMST MilstolpeFörsta året temp>MilstolpeÅr sedan förra milstolpen passerades
0.50 C1984
0.75 C200016
1.00 C201212
1.25 C20208
1.5020?

Det tar dubbelt så lång tid för årstemperaturen att stiga från 0.50 grader över förindustriell till 0.75 grader som det tar att stiga från 1.00 grader till 1.25 grader.

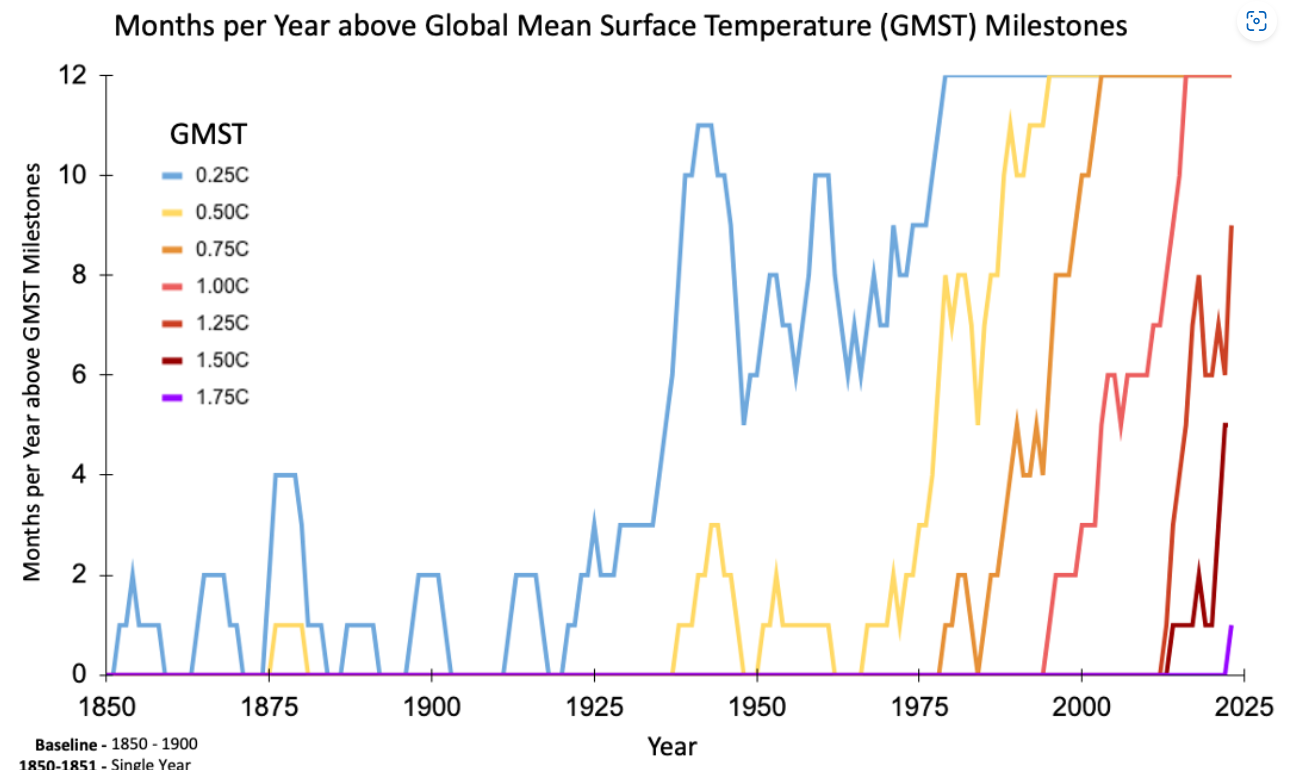
Tabell 4. År när 100 dagar legat över Milstolpe. Data från 1000 Days above 1.5C before Trend passes 1.5C? (parisagreementtemperatureindex.com)

Milstolpe Approximativt år 100 dagar > milstolpeÅr sedan tidigare Milstolpe
passerades
0.501944
0.75198036
1.00199818
1.25201012
1.5020177
1.7520247
2.0020??

Det tog 30 år för de 100 varmaste dagarna att stiga från 0.75 grader till 1.25 grader. Men bara 14 år från att de låg över 1.25 grader till att de låg över 1.75 grader. Fördubblad ökningstakt!

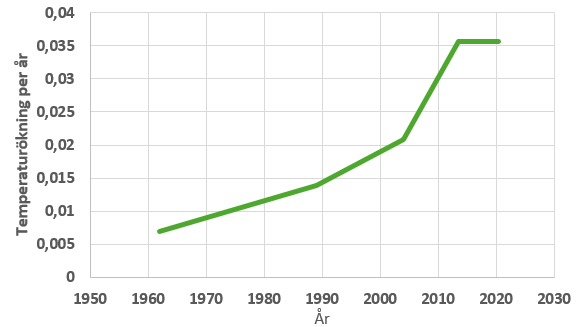
Det går att omvandla data från Tabell 4 till uppvärmning per år som en funktion av året som gjorts i Tabell 5 nedan.

Tabell 5 beräkning av global temperaturökning per år

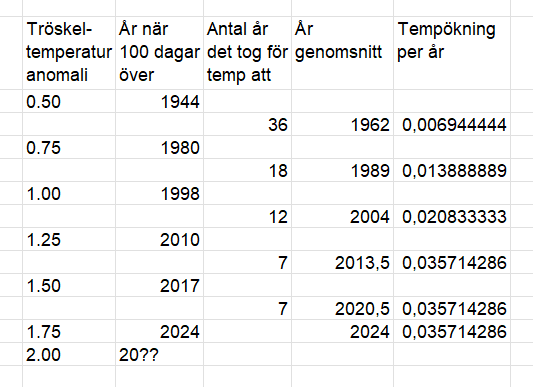
2024 för man naturligt eftersom de två föregående värdena är samma. Då får man nedanstående Figur.

Få är medvetna om hur snabbt uppvärmningen nu går och hur kraftigt uppvärmningens takt har ökat, Jag trodde definitivt inte detta innan jag började grubbla och tänka över det i slutet av 2023!

Vad beror effekten på om inte enbart accelerad uppvärmning? Själv tror jag en ökad variation i temperatur har betydelse, men det är inte speglat i en ökande variation i årsmedelvärdena. Det kanske är någon sorts växelspel med geografisk variation, dagligt variationsmönster, häftigare variationer i luftens och havens strömmar och säsongsvariation som döljer en lokalt ökande temperaturvariation. Att det blir varmare innebär att större energier och energiöverföringar är inblandade och det borde också öka variationerna. Det finns mycket att grubbla över här och de professionella klimatologerna verkar inte tänka i tillräckligt vida banor..

Comments on climate

Last edit 240721

Here I make some analyses constructing tables 1-3 based on data, terminology and considerations from https://parisagreementtemperatureindex.com/ Paris Agreement Temperature Index – Just how hot is it ? An excellant contribution to the knowledge of global warming by Chris Priest! I also added a Table 4 based on my own suggestion for a measure of global warming: When a temperature has been passed 100 days!

I have also below commented on presentations but nothing essential.

The global warming may be associated with another dramatically increasing change by time, which I have not seen well quantitavely documented somewhere else. The interval when the first days and periods with an increased temperature becomes much shorter.

See https://parisagreementtemperatureindex.com/1000-day-climate-graphic-design/ for temperature on earths surface data Global Mean Surface Temperature (GMST). The Milestones of temperature raise are 0.50, 1.00, 1.25, 1.50, 1.75 and 2.00 raise above preindustrial era.
The table 1 extracted shows year when First Day anomaly above GMST Milestone occured. There is a “random” variation among Days and Months confusing the picture. Thus even if no warming there is a variation in observed deviations, and a “first day or month” 0.25C warmer than average is expected to occur. When the rate of warming is smaller that has a bigger influence of year of first occurance. Thus the “true” intervals are less reliable earlier years when warming was smaller
.

Table 1

GMST “Milestone”First Day over MilestoneYears from First Day above previous First Day above Milestone Heating speed, degrees/year
0.75 CFeb 1941 
1.00 CJan 1958 190.25/19 =
1.25 CFeb 1995 370.25/37=
1.50 CDec 2015 200.25/20=
1.75 CFeb 2016 10.25/1=0.25
2.00 CNov 2023 70.25/7=

I formulated it on twitter as : It took only 8 years between the first Day with a temperature anomaly > 1.5 C and a Day with >2 C (end of 2023), while it took 57 years to raise from 1.0 to 1.5. It seems evident from Table 1 that it is a trend since 1958 to 2023 that it takes shorter time to pass from a Milestone to next.

Now consider the first Month above a Milestone from the figure at °C Milestones – From First Appearance to Permanence – Paris Agreement Temperature Index

To understand how well some of this information is known and discussed among professional climatologists I made comments on the blogg of the Swedish Meteorological and Hydrological Institute global uppvärmning pradoxala resultat – SMHI (kundo.se) . My opinion based on the response is that they are not very aware. I sent a reply but it seems neglected, the authority seems avoiding deeper discussions, but sticking to informing.

Between first month >0.75C and first month >1.25C it took 34 years
Between first month >1.25C and first month >1.75C it took 9 years

Table 2

Milestone, anomaly CYear first month >MilestoneInterval, years to previous Milestone
0.751979
1.00199717
1.25201417
1.5020151
1.7520238
2.00?

Data from, 1000 Days above 1.5C before Trend passes 1.5C? (parisagreementtemperatureindex.com)

Table 3

Milestone anomaly C Approximate year 100 days above milestone accumulatedYears since previous milestone passed
0.501944
0.75198036
1.00199818
1.25201012
1.5020177
1.7520247
2.0020??

Looking at Table 1 (first day) and 2 (first month) the intervals between passing different intervals are very “jumpy” while Table 3 (when 100 days warmer than Milestone) the intervals change in a smoothe way. It is also logic that the “first” time is more affected by other factors than the contineous heating and thus more uncertain. An advantage with 100 days instead of a higher number of days is that it gives more and more recent milestones. Demanding a high number of days may mean that the Milestone is passed after the full year value has passed the Milestone.

Table 4. Speed of Temperature raise when 100 days above a milestone accumulated

Between yearsAverage yearMilestones Ctemp raise, degree per year
1944-198019620.50-0.750.25/36= .007
1980-199819890.75-1.000.25/18= ,013
1998-201020041.00-1.250.25/12=. 021
2010-201720141.25-1.500.25/7 = .036
2017-202420211.50-1.750.25/7 = .036
2024 trend20240.25/7 = .036

Beräkning av hur snabbt den globala temperaturökningen sker  

Tröskel-temperatur ”anomali” grader CNär hade 100 dagar varit varmare än tröskeln?Hur många år tog det att öka 0.25 CGenomsnittsår för ökningenÖkning per årÖkning per decennium
0.501944 
3619620,00690,07
0.751980 
1819890,01390,10
1.001998 
1220040,02080,21
1.252010 
72013,50,03570,36
1.502017 
72020,50,03570,36
1.75202420240,03570,36
2.0020??? 

The results are visualised as a figure

A recent report about global warming (which also condense much of the available information around the warming) is ESSD – Indicators of Global Climate Change 2023: annual update of key indicators of the state of the climate system and human influence (copernicus.org) “Human-induced warming has been increasing at a rate that is unprecedented in the instrumental record, reaching 0.26 [0.2–0.4] °C per decade over 2014–2023.” Table 4 estimate is higher, but not “significantly higher”. Recent IPCC assessments concluded that the rate of increase in anthropogenic warming in 2021 was 0.2 °C per decade with a likely range of 0.1 to 0.3 °C per decade. My estimate (Table 4) is higher than that.

Temperature raise accelerated clearly to around 1980 but after that an acceleration is not evident from figures. The trend seems to have almost the same slope for maximum or mininmum temperatures. Plots at GMST Milestones – Mixed Data Set (parisagreementtemperatureindex.com) however trace acceleration. At first sight it seems small if the effect of hot last year period is not included. But at second sight I saw room for rather large acceleration. Thus it seems likely the shortening time intervals between milestones at least partly is caused by rapid acceleration of global warming.

As I see it a reason or contrbuting reason could be an increased temperature variation around the mean. But if so it is hard to explain why the difference between high and low values around the mean does not seem to increase, they actually seems larger 1900-1970. Perhaps changes in geograhic, seasonal and variation during day pattern could hide such variation.

Results seem contraintuitive at first sight! Much more thinking is needed on what is a reasonable explanation. Could it really just be rapid accelaration of global warming?

Below are comments to the author of the main material, who I try to help.

If separate analyses for sea and land are made instead of all surface, what happens when?

IPCC AR6 Synthesis Report: Climate Change 2023 — IPCC . 10 pages of formalities and starting on p 11 with average of the period 2011-2020. This can be considered a bit misleading in a report from 2023, especially¨as making anomaly 2015 the first bold point. Their alternative future projections have numbers rather than a “business as usual” scenario (to continue as 2020). First it is many unimportant pages and the most important essentials are sort of hidden. My main critic against UN bodies is that it is tabu to claim that we are too many. The word “Overpopulation” is tabu for UN. If the world population dropped to 2 billions, “net-zero” would be an easy target. With a growing population: no chance!

Keep to surface temperature and evaluations based on daily observations. Do not disturbe by other things! Leave that to others! It takes attention from the most important to go to deep into other things and as you do not work full-time on it better if focused! Just to keep focus and point at new considerations about the most essential observations!
Climate is more than temperature. Perhaps some other word?
You have a rubric and “definition” that 1.5 C is reached when 1000 days pass that. I do not like that, even if “climate” become 1.4 C permanent you would reach more than 1000 days after some time.
You make non linear fits which indicate that climate heating accelerates. But that is partly misleading, the past year has been unusally warm! The is a partly regular pattern how the oceans absorbe heat (la nina) and also other phenomenons. Look on the past! It would be very surprising if the “accerelation” did not look less dramatic if looking backwards 2026. Maybe a note on that.

It is temperature anomalies and maybe explain that better to those who are not so accustemed.

I like the graph “months per year above milestones”. It is pedagogic dealing with months and years. I suggest to have small year signs on the X-axis to facilitate own considerations (as it seems to be in the lower figure). It is not logic using different coulers in the lower figure than the higher and the Y-axis for months should stop at 12.

Is there an annual pattern in anomalies? Maybe your averages should consider that? Is that pattern changing over time?

Probably the heating over time accelerates, but the speed of acceleration is easily over-estimated at the end of a hot period there we are now.

Actually, we do not have the answers to the big questions. The majority of the universe is unknown, it consists mainly of dark matter and dark energy known only by their effect on gravity. We do not know how universe looks outside what we can see because the limits set by speed of light. We do not know if others are aware of their existence, we do not know if our spirit will survive death or not, nor do we know if there are higher levels of consciousness than our own. We do not understand how the universe began, and we are uncertain of how it will end. Einstein once said that God does not play dices, but it seems he do. Even mathematics has unprovable theorems. Thus it is a risk to rely too much on a mathematicical-physical models.